A Brief Re-Introduction of the Artemis Platform
From day one, the Artemis team has been focused on building out institutional data tools for the digital assets sphere to bridge the divide between traditional financial institutions and the budding realm of digital assets. As pioneers in creating institutional data tools tailored for the evolving world of digital assets, our mission has always been to bring first principles and long-term thinking into crypto. With our dedicated team of developers, analysts, and data scientists, we are building the go-to institutional data platform alongside the trailblazers of digital asset fundamental investing.
Today, we’re happy to announce a major leap towards that mission.
Enter: The Artemis Chart Builder
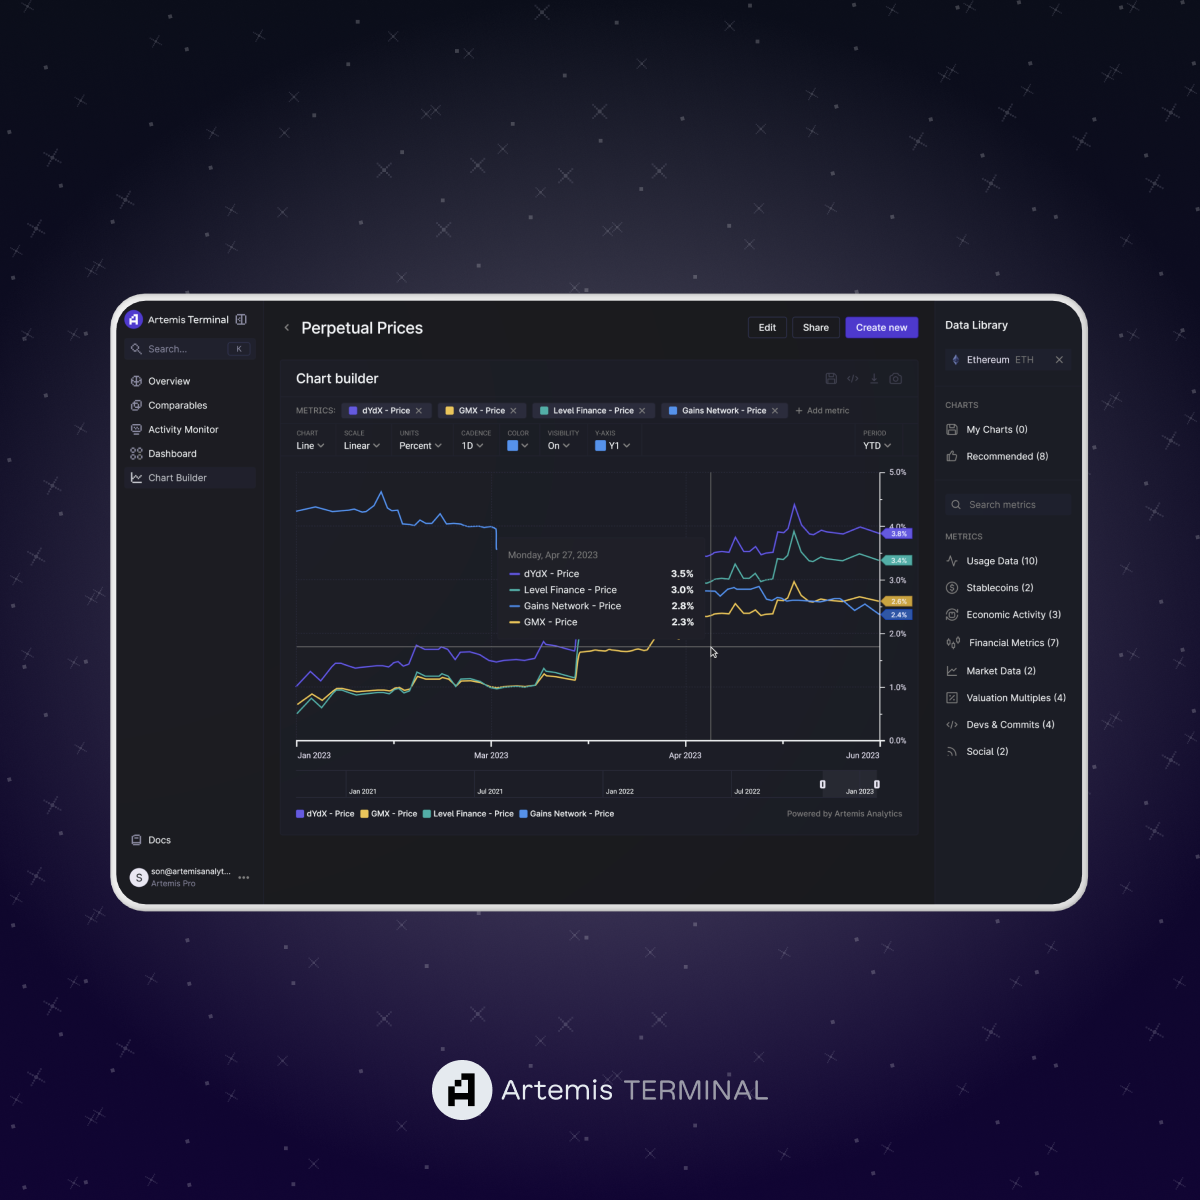
The team at Artemis is elated to introduce our newest product, the Artemis Chart Builder. This dynamic tool pulls together all of the information available on the Artemis Terminal into a single place, enabling the digital assets community to generate meaningful data-driven insights in a no-code environment. With this new tool, Artemis transforms from a read-only experience to a read/write platform allowing our users to manipulate and customize all of our available datasets.
A Next-Gen Charting Tool for Digital Assets
Imagine having the power of platforms like Bloomberg and FactSet, but tailored meticulously for digital assets. That's precisely what our chart builder and dashboard creator brings to the table. Here’s what you can expect:
Customization at Your Fingertips: Craft your own dashboards and charts using a plethora of data available on the Artemis platform. Design it to suit your preferences, streamline your analyses, and sharpen your financial decisions.
Collaboration Made Easy: Share your uniquely crafted dashboards and charts with your team and community. Edit your dashboards in real-time, ensuring that your team is always on the same page.
In-depth Data Access: Dive deep into the digital realm with access to fundamental data. From gas usage by sector, daily active addresses to transactions across various applications, layer 1, and layer 2 blockchains—our tool offers a massive breadth of insights.
This new interface allows users to interact with fundamental crypto data using a powerful no-code set of features - and gives Artemis users the highest level of flexibility and customizability in your data journeys.
Using our new tools, you will be able to create custom dashboards and charts using all of the data that you can find on the Artemis Terminal. This tool will allow us you to craft and share all of the metrics that matter for you and dive deeper into the digital assets space.
Some of the narratives we’ve been exploring using our Chart Builder interface:
Artemis Core L1 / L2 Dashboard:
This Core Dashboard is an Artemis-built dashboard providing a fundamental lens across the L1 / L2 ecosystem. It tracks core metrics such as:
Price Changes: Visualize changes in token price over time or index a basket of tokens to see how prices have performed since a historical point in time
Gas Fees: Analyze how gas fees differ across top blockchain networks including Bitcoin, Ethereum, Solana and Avalanche, and easily track changes in historical trends
Active Addresses: Compare active address activity across all the blockchain networks you care about in a single place and quickly notice anomalies over time
Decentralized Perps Dashboard:
This Decentralized Perps Dashboard provides an in-depth look across the key metrics and applications that matter within this rapidly growing asset class. The dashboard includes:
Perps Trading Volumes: Visualize perpetual trading volumes across major decentralized exchanges within a single interface
Perp Exchanges TVL: Examine changes in TVL across decentralized perps to assess the underlying health of a specific protocol
Unique Traders: Compare unique traders on different decentralized perpetual platforms to gauge overall activity and trading volume per user
Getting Started: Artemis Chart Builder/ Dashboard
While the Artemis Chart Builder is an incredibly powerful tool, it can be quite daunting for first time users. Below, we walk through how to get started using Artemis to build custom dashboards packed with fundamental insights.
Log into the Artemis Terminal and click on “Chart Builder.”
Create a Chart! After inputting a title and description, start adding datapoints from our extensive data library and customize the chart to your heart’s content. Move data points across different axes, change a line graph into a stacked bar chart and more with the built-in functionality of the Artemis Chart Builder.
Create your own dashboard filled with the insights you care most about! The Artemis Terminal is a fully flexible interface that allows you to add the most important charts onto a single page.
Ultimately, the Artemis Chart Builder pushes us one step further towards our mission of bringing first principles thinking and data-driven decision making to the digital assets space. We believe that the world of digital assets unlocks a future with greater transparency and equality of opportunity for investors and builders, and that institutional-grade data tooling and research is necessary to help get us there. We are excited to continue playing a role in bringing that future to light.
We Want to Hear from You!
As much as we pride ourselves on innovation, we also recognize the importance of feedback. Our tools are made for you, and as such, we highly value any and all insights from our community. We invite you to share your thoughts on our new interface, any additional features you'd like to see, and suggestions on new metrics that can elevate your experience.
Join us in this exciting journey into the future of digital asset analysis. Let's craft the future, one dashboard at a time.
The Artemis Team


