Introducing: Artemis Blockchain Activity Monitor (BAM)
a new tool in your crypto analysis arsenal
Since the inception of Artemis, our team’s mission has been to answer all the key questions you have about crypto. What’s happening on Ethereum? How many users use Arbitrum vs. Optimism? What games are people building on blockchains and are people playing them? Today, we’re happy to announce that we have taken a step forward in understanding what REALLY happens on blockchains.
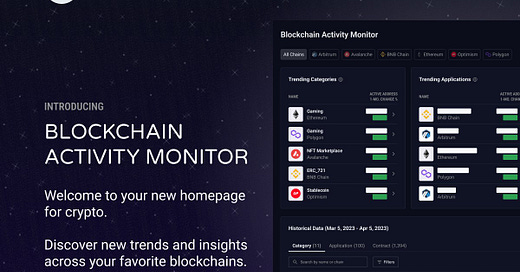
Enter: the Artemis Blockchain Activity Monitor
The Blockchain Activity Monitor provides an in-depth look at application-level activity across six EVM compatible platforms: Ethereum, Arbitrum, Optimism, Polygon, BNB Chain and Avalanche. Below, we walk through the different components of the product to help you find the most on-chain alpha possible.
Here are some of the narratives we’ve been tracking using the Activity Monitor:
🌊The Rise of Layer 2s
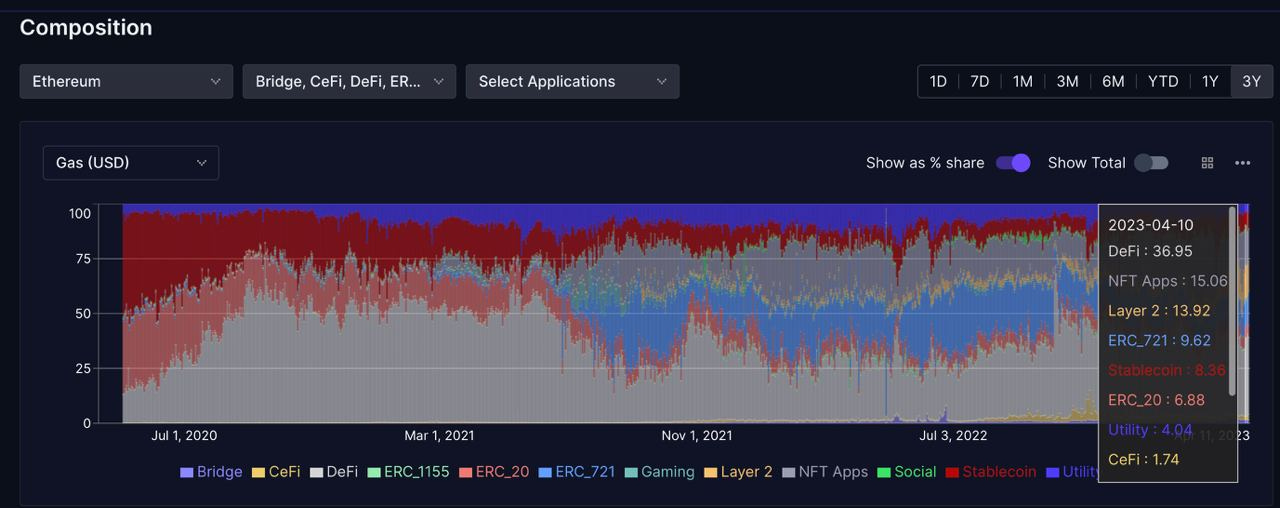
Layer 2s have grown significantly in stature with significant growth in active addresses and gas usage as a % of total ETH L1 gas usage. Below, we can see Layer 2 capturing as much as 14% as a % of total Ethereum gas usage on a given day.
Of these scaling solutions, we can see ZK Sync, Arbitrum and Starknet making up ~75%+ of total gas usage. ZK airdrop farming appears to be in full swing 🎅
🦾NFT Marketplace Wars: Opensea vs. Blur usage
The Opensea vs. Blur wars are in full swing after Blur’s airdrop on Valentine’s Day earlier this year (Feb 14th). Has Blur been able to retain usage post airdrop? Looking at daily active address market share between the two platforms - the answer appears to lean towards no 🙅 . Blur saw a bit of elevated usage immediately post airdrop but topped out at ~20k daily active users, and is now back down to ~5k daily active users.
Meanwhile, Opensea maintained ~27k daily active users right after the Blur airdrop (February 15, 16) and has steadily held those user numbers through April (~24-25k daily active users today).
While these are just some of the narratives our team has discovered, there is plenty more the platform is built to handle, and we’ll walk through exactly how to use it below 👇
Protocol Composition: The Holy Grail View of EVM Compatible Chains
Using the Composition View, you can see Active Addresses, Gas Usage and Transactions across blockchains and applications in a side-by-side manner.
From here, we’re able to dive deeper into a specific application category on a Blockchain. As an example, we click into DeFi on Ethereum, the application category that has the most number of active addresses across all blockchains today.
Clicking DeFi in the table above gets you to…
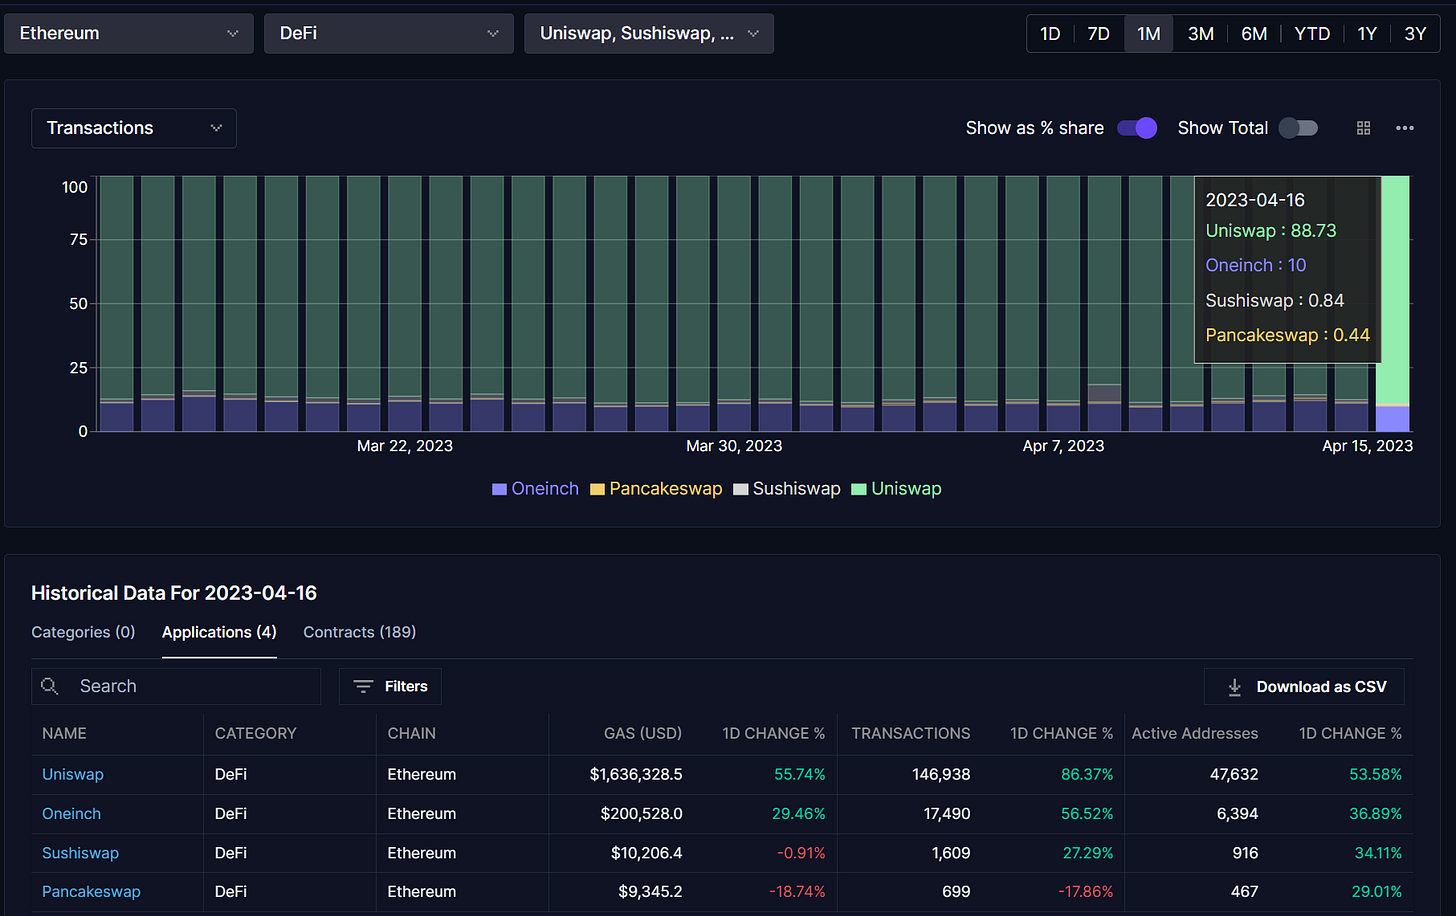
…Ethereum’s top DeFi applications. Within this view, we can see the top applications by active addresses within this category, which includes household names such as Uniswap and Oneinch. We can then go and compare several applications side-by-side to better understand how usage between them have been changing.
Above, I am looking to evaluate several DEX protocols side by side to better understand usage and gas consumption. In this first graph, it becomes clear that Uniswap is the definitive winner on Ethereum Layer 1 vs. other household names such as Oneinch and Sushiswap with a whopping ~89% market share of Active Addresses. Swapping the view to transactions…
and gas usage…
tells a similar story of Uniswap’s dominance.
Trending Applications
The Blockchain Activity Monitor also offers separate views including the “Trending Applications View" which opens up to the “Application Screener”.

Clicking “View All Applications” or “View All Categories” opens up the Application Screener.
Here you’re able to filter applications by certain criteria to discover new protocols and trends. In the picture below, we are filtering for Gaming applications across all chains to find the games with the most active addresses.
Here we can see that Planet IX on Polygon is heads and shoulders above all other applications from a Active Addresses perspective with a sum of ~335k active addresses over the last month 😱
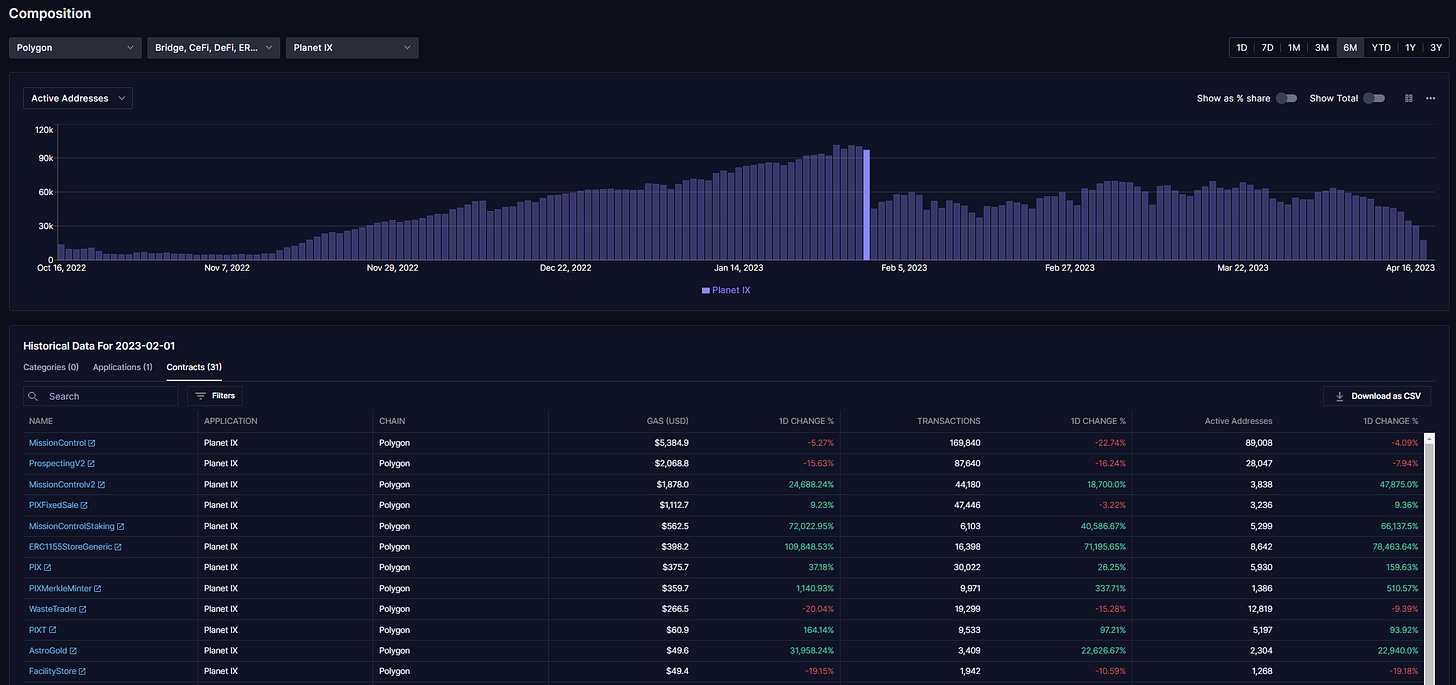
Clicking into the Planet IX app - we can see daily active addresses for the game over a time-series of our choosing. We can see that Planet IX is seeing ~30-40k daily active addresses per day, which is more than ~10% of the total activity taking place on Polygon every day (total Polygon daily active addresses of ~250-300k in the past month.
Gaming gas usage as a % of total gas consumed on Polygon is also quite absurd 👀. The figure has grown from ~5-10% in October 2022 to almost ~50% over the past few months (January through March). Something the Artemis team will be keeping an eye on going forward 🫡
And that’s just the beginning - the Blockchain Activity Monitor was built to answer every fundamental question you have about blockchains. Keep an eye out for new features, chains, and functionality 💥
Got more questions?
Please join us this Thursday April 20th for an hour-long demo session to walk through exactly how top web3 analysts use the Blockchain Activity Monitor and other Artemis products. Sign up for the event here!
We’re incredibly excited to partner with MetricsDAO on this event to connect with the best web3 analysts in the world🤝! Check it out to learn how to utilize the suite of Artemis products to find more on-chain alpha 🫡
https://twitter.com/Artemis__xyz/status/1644132531103494145?s=20


Awesome, you guys shipped fast!
Good job team.
EDIT: The URL of the signup page for the event (mentioned at the bottom of your article) goes to a 404 Eventbrite.