Bridging the Gap #1: Crypto Correlations
We are Artemis.xyz, a lean team building products that make blockchain data more accessible and more useful. Check out our MVP product, subscribe to our newsletter below, and follow us on Twitter.
Intro:
Welcome to the first edition of: “Bridging the Gap,” our new weekly newsletter concept. Each week, we will pick a topic in crypto and relate it back to traditional financial concepts and benchmarks (we were very close to making the name a GAAP pun, but better judgement prevailed).
The crypto / web3 movements have introduced novel business models, incentive mechanisms, terminology, and metrics. Still, the largest digital assets are traded on exchanges (like public equities broadly), and represent a bet on nascent technology with mostly unproven financial profiles (like many other risk assets in the private and public markets). We believe that bridging these often siloed worlds can drive more powerful analysis, and think that doing so will increase in importance as blockchain projects mature and institutional capital flows into the space.
We will still be sharing other ad hoc pieces / deep dives, like we did for Maple. We hope you enjoy, and as always want your honest feedback on how we can improve.
—
Crypto correlations:
In previous work, such as our Q2 performance update, we’ve noted the tight relationship between many tech equities and major crypto assets (for example, their eerily similar - and painful depending on what you hold - declines from 52-week highs).
But, this is all a bit anecdotal. We wanted to add rigor in determining how correlated crypto assets really are to major TradFi benchmarks.
A brief primer on measuring correlation:
Most people reading this article probably have a baseline understanding of correlation. If that is the case, skip ahead to the following section. If not, here’s a quick primer:
Correlation measures the propensity for two variables (such as % change in price) to move together.
It is denoted as a coefficient (r) between -1 and 1.
r of 1 implies perfect correlation —> two things move directionally in a consistent manner.
r of -1 implies perfect inverse correlation —> two things will move in the opposite direction, but still in a consistent manner.
Importantly, correlation does not tell us how much two variables move relative to each other. Perfect correlation can occur regardless of whether asset A moves 100% for every 2% move in asset B, or 20% for every 10% move. This relates to beta, which we will get to below.
A quick note on our methodology: to analyze correlation and beta, we look at price change between subsequent official trading days. This helps adjust for the fact that traditional markets are closed on weekends and holidays.
How correlated is crypto to other asset classes?
BTC: Let’s start by considering BTC, the largest crypto asset by market cap. Per the below (which looks at trailing 30 day avg. correlation), BTC:
Has grown increasingly correlated to the S&P and Nasdaq over time.
Reached a peak correlation of nearly 0.8x with both the S&P and Nasdaq in Q2 (this is very close to perfect correlation).
Is less correlated to ARKK (an actively managed basket of high growth, riskier tech assets vs. the S&P or Nasdaq).
Has not been very correlated to the price of gold (multi-year average of < 0.2x correlation).
ETH: The story is largely the same with ETH, which has become increasingly correlated to equities over time and has shown very little correlation to gold.
Finally, what about other tokens? Just like BTC and ETH, most tokens are at least moderately correlated to the Nasdaq, S&P, and ARKK, but not correlated to gold (we switched formats for this view to save some screen real estate).
What about beta?
Whereas correlation is helpful in measuring the propensity of two things to move together, beta is more helpful in measuring how much they move relative to one another. Again, this is likely review for many, but a quick and dirty summary of beta: If an asset is perfectly correlated to its benchmark and has a beta of 2, it means that the asset moved 2% for each 1% move in the benchmark.
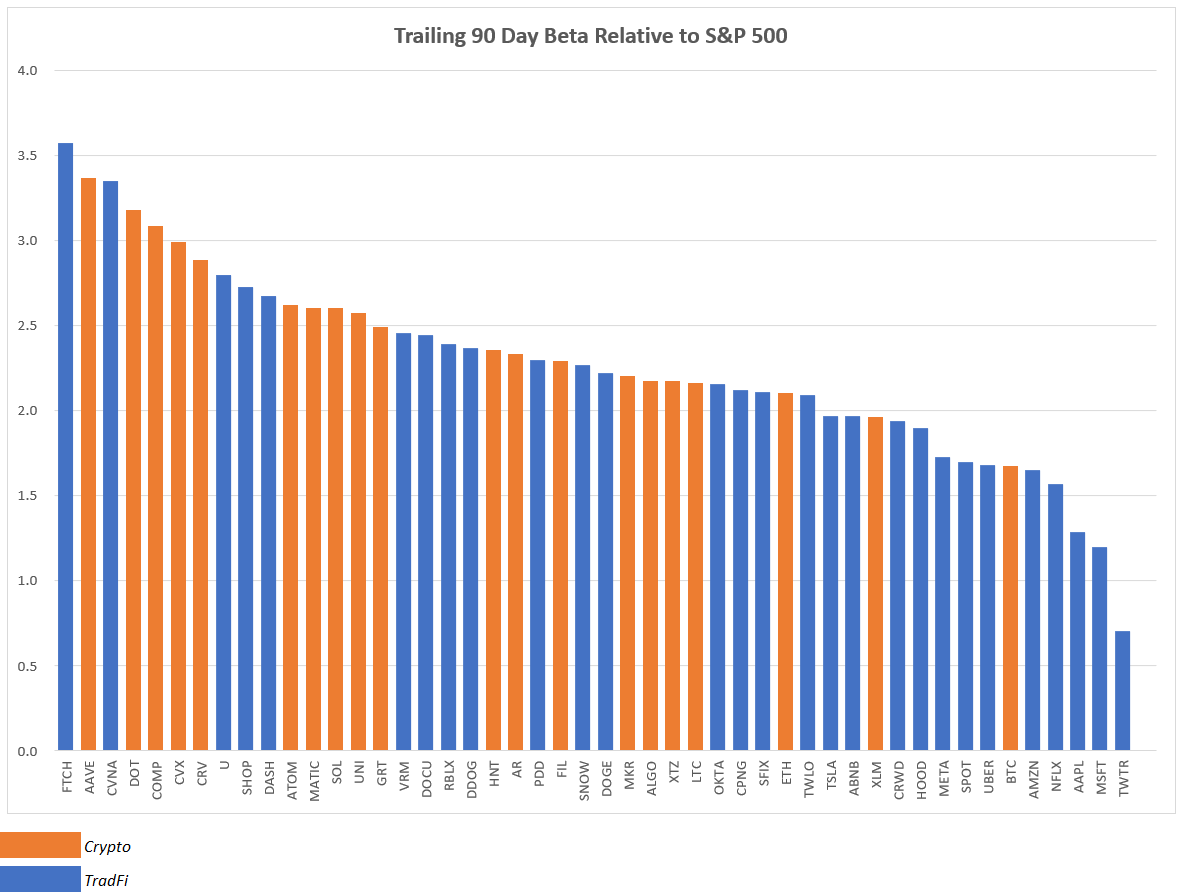
Most large cap crypto assets have betas of > 1.5 relative to the Nasdaq and S&P (betas are higher relative to the S&P because it is less volatile than the Nasdaq).
How does this compare to high growth tech stocks?
For simplicity, let’s just consider how growth tech stocks and digital assets move against the S&P 500.
Not surprisingly, digital assets are less correlated to the index than high growth tech stocks (but not by much).
Most digital assets are also on the higher end in term of beta and volatility within this set of names.
Why does any of this matter?
For one, understanding correlation can help validate or invalidate market narratives. It is clear, for example, that BTC trades more like a risk-on technology asset than digital gold (traditional gold is a relatively non-correlated asset class, and therefore provides valuable diversification for investors). This will have (and likely has already had) an impact on how institutions decide to allocate capital in the space.
The data is also a reminder that macro factors like interest rates and capital flows can impact price far more than idiosyncratic developments at the project level. This may seem like an obvious point, but given a lot of the bullish discourse on crypto Twitter (around the Ethereum Merge, for example) that does not take TradFi or macro conditions into account, it is important frame to keep in mind.
There are a bunch of other implications we can think of, but we’d love to hear from you in the comments below!
—


