Artemis.xyz Weekly Ecosystem Wrap-up (1/13/2023)
your go-to source for weekly fundamental updates
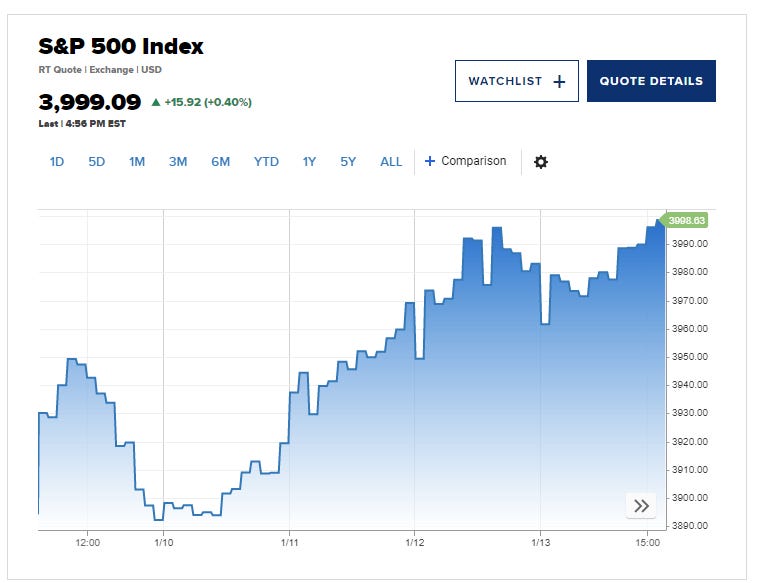
Happy Friday folks. Lots to unpack - the second week of Jan saw a whopping ~30% average price increase over the past 7 days alongside the best week for the S&P 500 and Nasdaq since November 🤯

L1 Overview & Highlights
Price / Activity WoW Change:
This week saw meaningful increases in price across the board (literally every token we cover in this article) with an average price increase of ~30% across the ecosystem. APT and OP saw the largest weekly gains of ~81% and ~56%, respectively while AVAX, SOL and FTM saw mid-30% gains.
The weakest price performers (if we can even call them that) among the majors were BNB and ETH, with a measly ~13% and ~15% WoW gain.
The bullishness in the crypto markets appears to mirror the run-up in tradfi: the S&P 500 and NASDAQ both saw the best weeks since November 2022 as investors “digested bank earnings and bet inflation would ease in 2023” per CNBC.

Trading Volumes WoW Change:
This week saw heightened trading volume across the board, with significant 24H trading as a % of total market cap in tokens such as OP (85%), FTM(42%) and APT (73%) which also happened to be tokens that saw the highest price gains over the past week.
Solana continued to be the most highly traded token after ETH, with $5.8bn in volume traded over the past week. BNB and ADA came in 3rd and 4th with $3.9bn and $3.3bn of 7D volume, respectively. ADA just continues to see huge nominal volumes of its token traded…
OP, FTM and APT saw the highest 7D trading volumes as multiple of its circulating market cap, with all three tokens trading nominal values of more than 100%. These three tokens also saw the largest price appreciations over the same time period 🧐🧐
Developer / User Activity WoW Change:
Core weekly active developer activity did not pick up in the first week of January (note that our developer activity data is as of 1/6 and is procured at a one-week lag).
However, weekly active addresses have continued to gain in the past week, with meaningful increases in activity from several major platforms including BNB, Arbitrum and NEAR (16%, 22% and 173% WoW activity, respectively). Daily Active addresses for the largest ecosystem, BSC, saw a ~16% increase over a 7 day period and remains 2x larger than Ethereum’s DAAs, and roughly 1.5x larger than Solana’s DAAs.
NEAR saw the largest increase in activity in the past week with daily transactions and daily active addresses exploding (72% and 173%, respectively).
ecosystem highlights below 👇
Avalanche
AVAX had a huge week with a brand new partnership with AWS - the news sent the token soaring with a ~27% WoW increase in price.
The partnership appears centered around helping AVAX work with governments and enterprises to bring broader adoption to the blockchain ecosystem.

Ava Labs has previously announced partnership with blue-chip financial institutions such as KKR to bring on-chain tokenization of private equity funds. We’ll definitely have our eyes peeled on further developments with governments and enterprises on the Avalanche chain.


NEAR
NEAR has been gaining rapidly over the past few weeks with meaningful growth in daily active addresses and transactions (3M increase in DAAs and DTs of 67% and 13%, respectively). With that said, there hasn’t been significant inflow of TVL or Stablecoin volume on the platform during this time, which leads us to speculate that NEAR NFT activity. Per “Cross Chain Monitoring Streamlit,” it does appear that NFT sales volume spiked for NEAR in the new year.
Do you know what collections folks are buying on NEAR? Come tell us in our discord or telegram!
Aptos
Aptos had the largest price jump over the past week (a whopping ~81%) and a sizeable increase in daily active addresses and transactions over the same period - up 8% in DAAs and 15% in DTs. This occurred despite a decline in TVL (down 8% WoW) and modest increase in stablecoin volume (up 6% Wow).
What are folks building / using on Aptos? We aren’t able to draw a direct line between any changes in fundamental activity vs. the price action that occurred this past week. The token could still be subject to high levels of speculative trading as short-term traders came out in waves in the midst of a bullish macro week.
For perspective, APT saw 7D trading volumes equivalent to ~209% of its total circulating market cap, even with low Stablecoin volumes and TVL (~$51mm and ~$47mm, respectively) compared to other blockchain ecosystems. The only tokens that saw more trading volume as a % of circulating market cap was OP, a much larger ecosystem from a TVL and Stablecoin perspective (~10x that of APT). What’s going on? Artemis will continue to dig in 👩💻
Artemis Sheets Templates:
We now have templates live on our website! Come check them out here!
Download our layer 1 dashboard directly into your own excel / google sheet, or check out our ARTDUNE function to pull Dune dashboard data directly into your core workflow 👇
Detailed L1 dashboard for people who love more numbers in smaller font:
Note: Revenue represents fees that go to the protocol’s treasury or are returned to tokenholders via a burn mechanism (source: Token Terminal). Weekly commits and weekly dev activity as of 1/6/22.


